Monitoring the Netgear ReadyNAS with SNMP
13 Jun 2023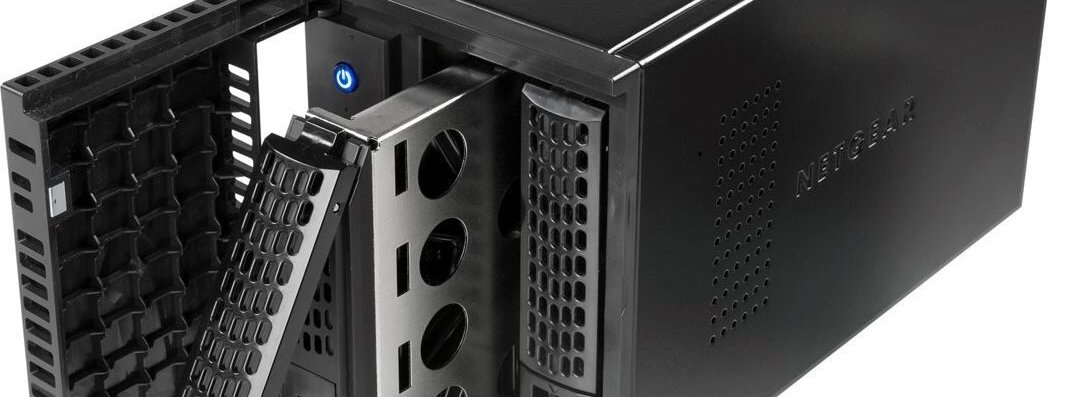
As my home server setup grew, I realized the importance of monitoring various aspects of my infrastructure, including my Netgear ReadyNAS 312. The NAS plays a critical role in storing my valuable files, and I wanted a way to proactively detect any potential issues such as failing disks or problems with RAID configurations. In this blog post, I will share my journey of setting up SNMP monitoring for my NAS and how I leveraged snmp_exporter to collect and visualize the health metrics.
Enabling SNMP on the Netgear ReadyNAS
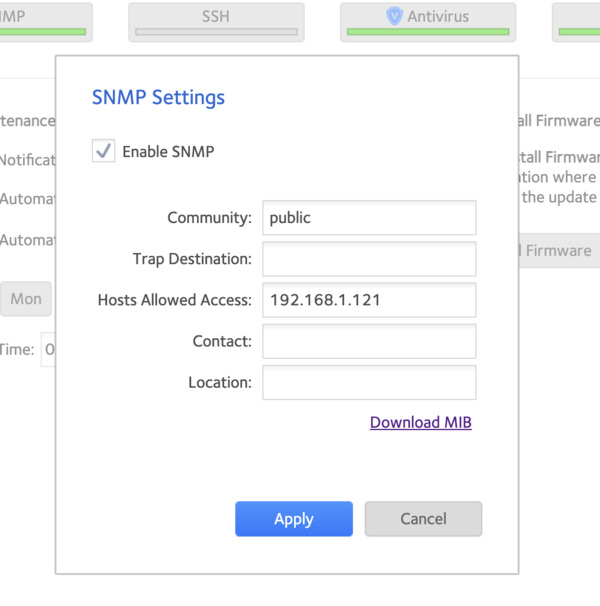
The first step was to enable SNMP on my Netgear ReadyNAS. SNMP (Simple Network Management Protocol) is a protocol that allows monitoring and management of network devices. The S stands for simple, but trust me: there’s nothing simple in it. I enabled SNMP using the default community string public and configured an access control IP to restrict access to the monitoring container.
Exploring the MIBs
Once SNMP was enabled, I encountered the SNMP Management Information Base (MIB), which describes the elements and attributes available for monitoring through SNMP. However, understanding the MIBs and extracting relevant information can be a daunting task.
To simplify this process, I discovered that snmp_exporter provides a configuration generator. By providing the Object Identifiers (OIDs) of the desired metrics, snmp_exporter can automatically retrieve the corresponding values. After some searching, I found a comprehensive list of compatible OIDs for the Netgear ReadyNAS on oidview.com and observium.org.
For example, here are a few OIDs I used to monitor various metrics:
Name = 1.3.6.1.2.1.1.5.0
Uptime = 1.3.6.1.2.1.25.1.1.0
RaidState = 1.3.6.1.4.1.4526.22.7.1.4.1
HDD1State = 1.3.6.1.4.1.4526.22.3.1.9.1
HDD2State = 1.3.6.1.4.1.4526.22.3.1.9.2
HDD3State = 1.3.6.1.4.1.4526.22.3.1.9.3
HDD4State = 1.3.6.1.4.1.4526.22.3.1.9.4
CPU1 = 1.3.6.1.2.1.25.3.3.1.2.196608
CPU2 = 1.3.6.1.2.1.25.3.3.1.2.196609
Fan1RPM = 1.3.6.1.4.1.4526.22.4.1.2.1
Fan2RPM = 1.3.6.1.4.1.4526.22.4.1.2.2
Fan3RPM = 1.3.6.1.4.1.4526.22.4.1.2.3
HDD1Temp = 1.3.6.1.4.1.4526.22.3.1.10.1
HDD2Temp = 1.3.6.1.4.1.4526.22.3.1.10.2
HDD3Temp = 1.3.6.1.4.1.4526.22.3.1.10.3
HDD4Temp = 1.3.6.1.4.1.4526.22.3.1.10.4
FreeSpace = 1.3.6.1.4.1.4526.22.7.1.6.1
TotalSpace = 1.3.6.1.4.1.4526.22.7.1.5.1
CPUTemp = 1.3.6.1.4.1.4526.22.5.1.2.1
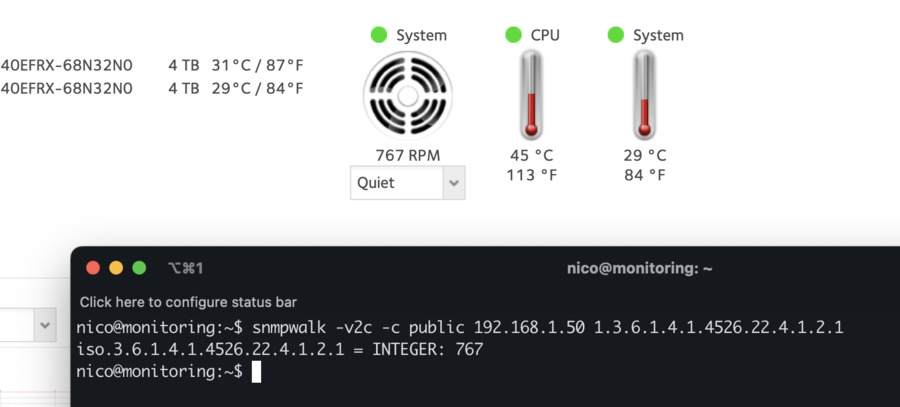
Using the snmpwalk command, I could fetch the value of a specific metric by providing the corresponding OID:
snmpwalk -v2c -c public 192.168.1.50 1.3.6.1.4.1.4526.22.4.1.2.1
To streamline the configuration for snmp_exporter, I created a shorter “walk” list, containing only the necessary OIDs for the generator:
readynas:
    walk:
      - 1.3.6.1.2.1.1.5               # Name
      - 1.3.6.1.2.1.25.1.1            # Uptime
      - 1.3.6.1.4.1.4526              # RAID/Disks status
      - 1.3.6.1.2.1.25.3.3.1.2        # CPU status
By using this configuration, snmp_exporter was able to collect and expose all the desired metrics accurately.
Leveraging snmp_exporter
With the snmp.yml configuration file correctly set up, snmp_exporter was ready to collect SNMP metrics from the Netgear ReadyNAS. Upon running snmp_exporter with the generated configuration, I obtained the expected results:
ataError{diskNumber="1"} 0
ataError{diskNumber="2"} 0
diskCapacity{diskCapacity="4000787030016",diskNumber="1"} 1
diskCapacity{diskCapacity="4000787030016",diskNumber="2"} 1
diskID{diskID="sda",diskNumber="1"} 1
diskID{diskID="sdb",diskNumber="2"} 1
...
diskSlotName{diskNumber="1",diskSlotName="1x1"} 1
diskSlotName{diskNumber="2",diskSlotName="2x1"} 1
diskState{diskNumber="1",diskState="ONLINE"} 1
diskState{diskNumber="2",diskState="ONLINE"} 1
diskTemperature{diskNumber="1"} 31
diskTemperature{diskNumber="2"} 29
fanNumber{fanNumber="1"} 1
fanRPM{fanNumber="1"} 767
fanStatus{fanNumber="1",fanStatus="ok"} 1
...
temperatureMin{temperatureNumber="2"} 1
temperatureNumber{temperatureNumber="1"} 1
temperatureNumber{temperatureNumber="2"} 2
temperatureTyoe{temperatureNumber="1",temperatureTyoe="coretemp-isa-0000-temp2"} 1
temperatureTyoe{temperatureNumber="2",temperatureTyoe="it8721-isa-0a00-temp2"} 1
temperatureValue{temperatureNumber="1"} 46
temperatureValue{temperatureNumber="2"} 29
volumeFreeSpace{volumeNumber="1"} 1.517965e+06
volumeName{volumeName="files",volumeNumber="1"} 1
volumeNumber{volumeNumber="1"} 1
volumeRAIDLevel{volumeNumber="1",volumeRAIDLevel="1"} 1
volumeSize{volumeNumber="1"} 3.809196e+06
volumeStatus{volumeNumber="1",volumeStatus="REDUNDANT"} 1
To simplify the process for other users, I submitted a pull request to the snmp_exporter repository, which includes the required configuration for Netgear hardware. In the meantime, you can try out the configuration from my fork of the repository.
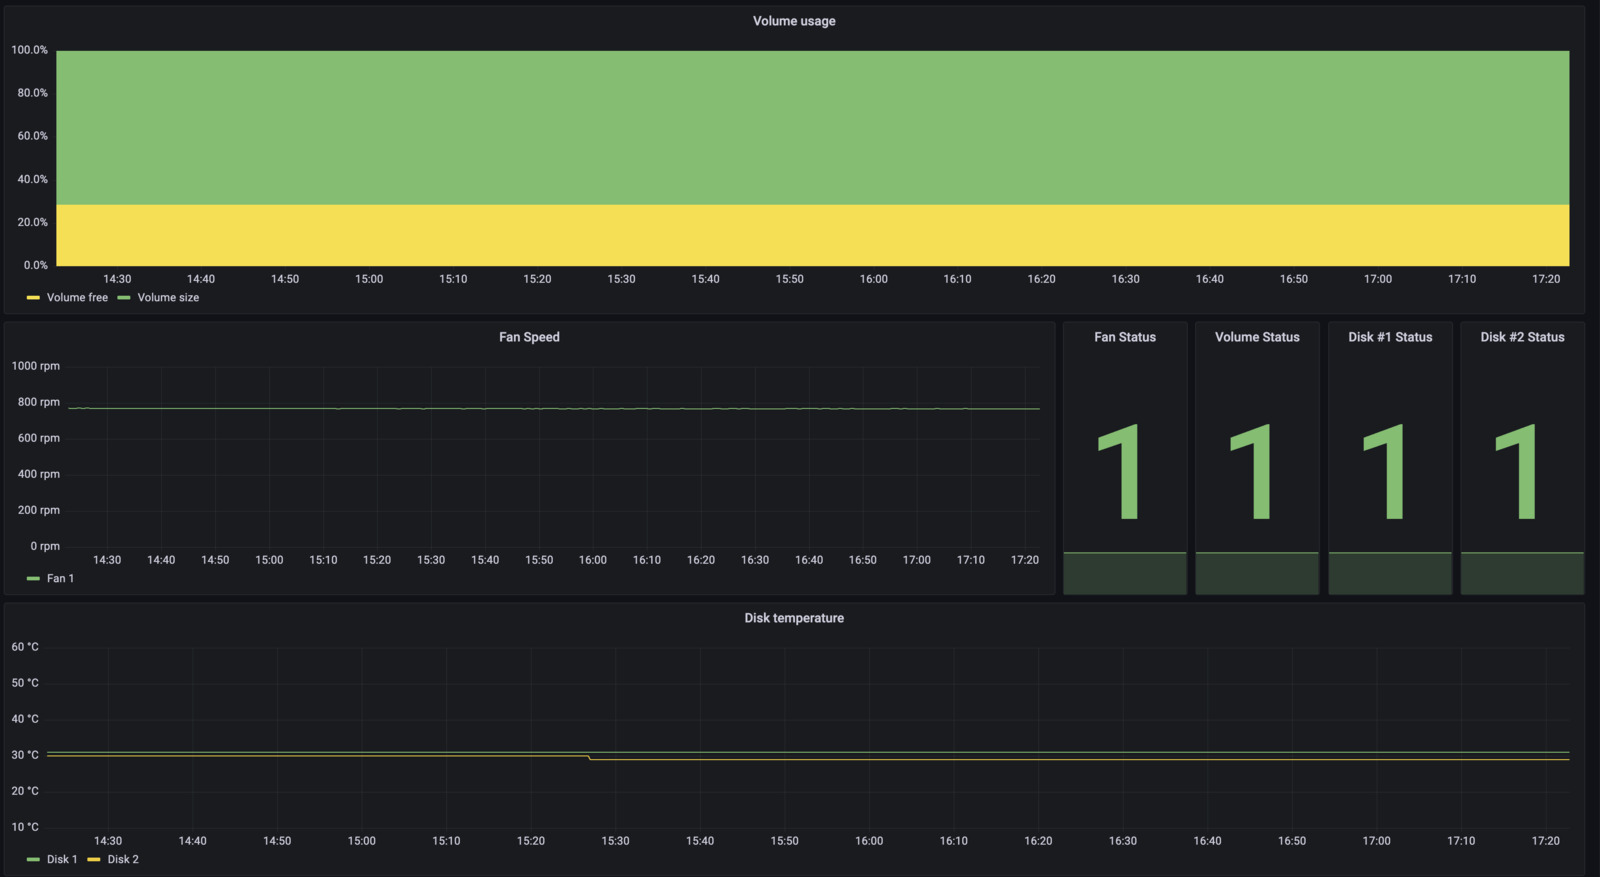
With SNMP monitoring in place, I now have peace of mind knowing that I can detect and resolve any potential problems with the Netgear ReadyNAS before they cause significant data loss or system downtime. I encourage you to explore SNMP and snmp_exporter for your own monitoring needs, as they offer a powerful and flexible solution for monitoring network devices.