

AC power meter
27 Mar 2024I’ve been investigating those generic WiFi AC power meters for the last few months, like this one. I’m not entirely happy about connecting third-party stuff to my local network. Even though I have a separate VLAN for IoT, it’s weird to install someone else’s hardware with god knows what kind of software it runs. So, I decided to build my power meter.
Things to take into account:
- I need a 220V AC power meter.
- I want to measure 4 AC lines simultaneously (air conditioner line, oven, lights, and power outlets).
- I need it to export Prometheus metrics for my monitoring system.
- I want a screen so I can peek at it during the day.
-
Ideally, I want to keep the AC wiring, so a non-invasive sensor is encouraged.
- Sensors
- Reading and conditioning the signals
- Displaying values
- Prometheus exporter
- 3D printed case
- Bill of Materials
- Pictures
- Video showoff
- Files and Resources
Sensors
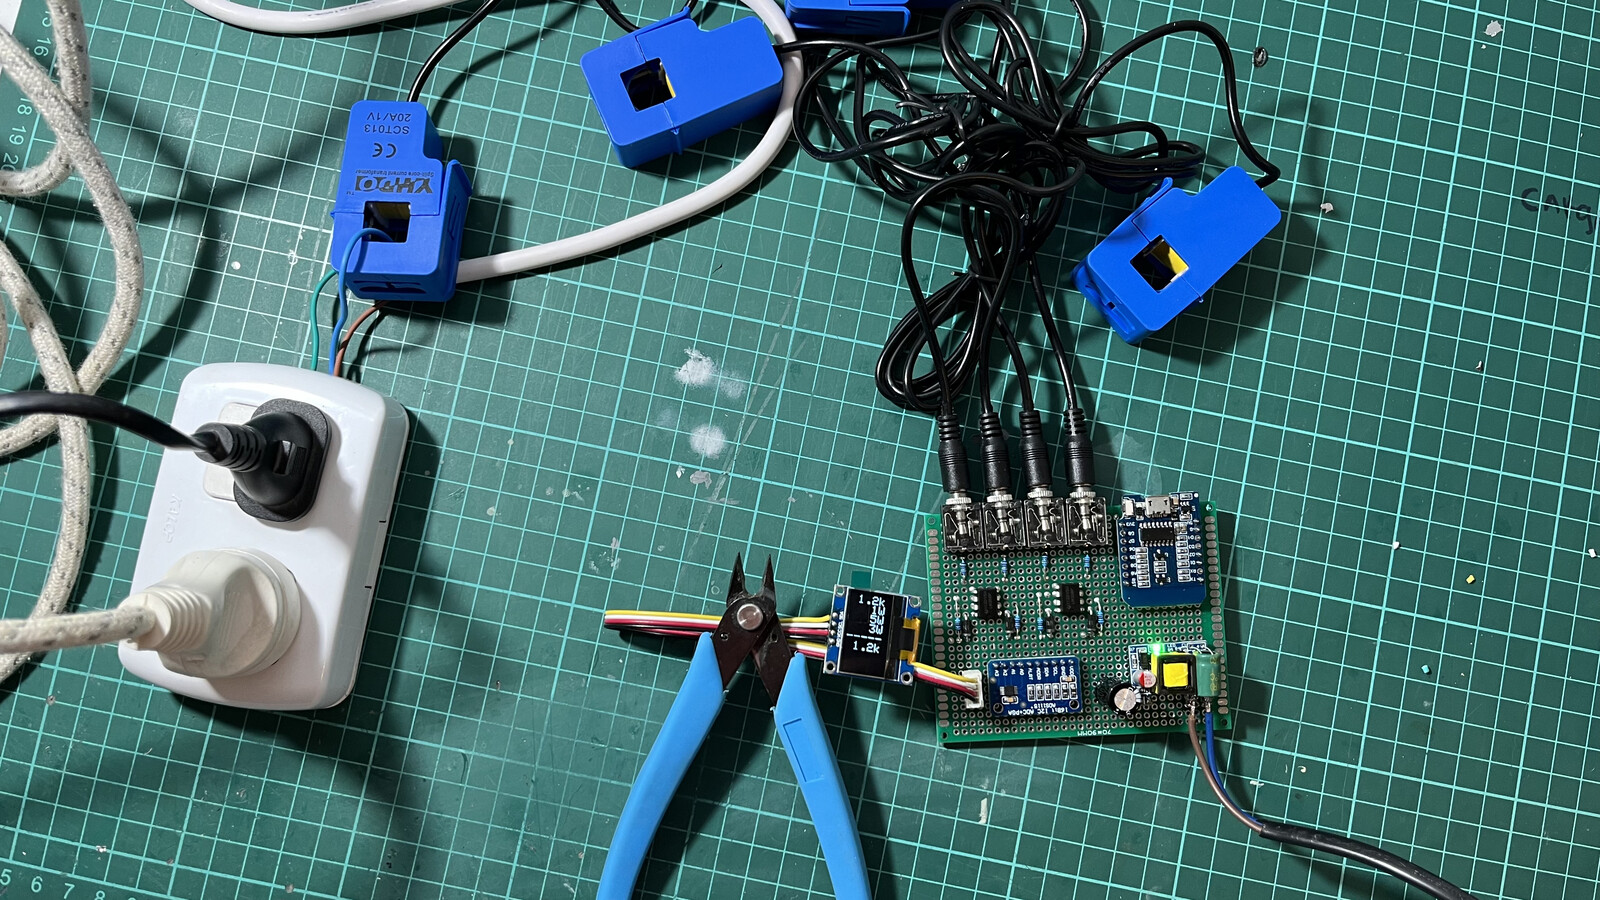
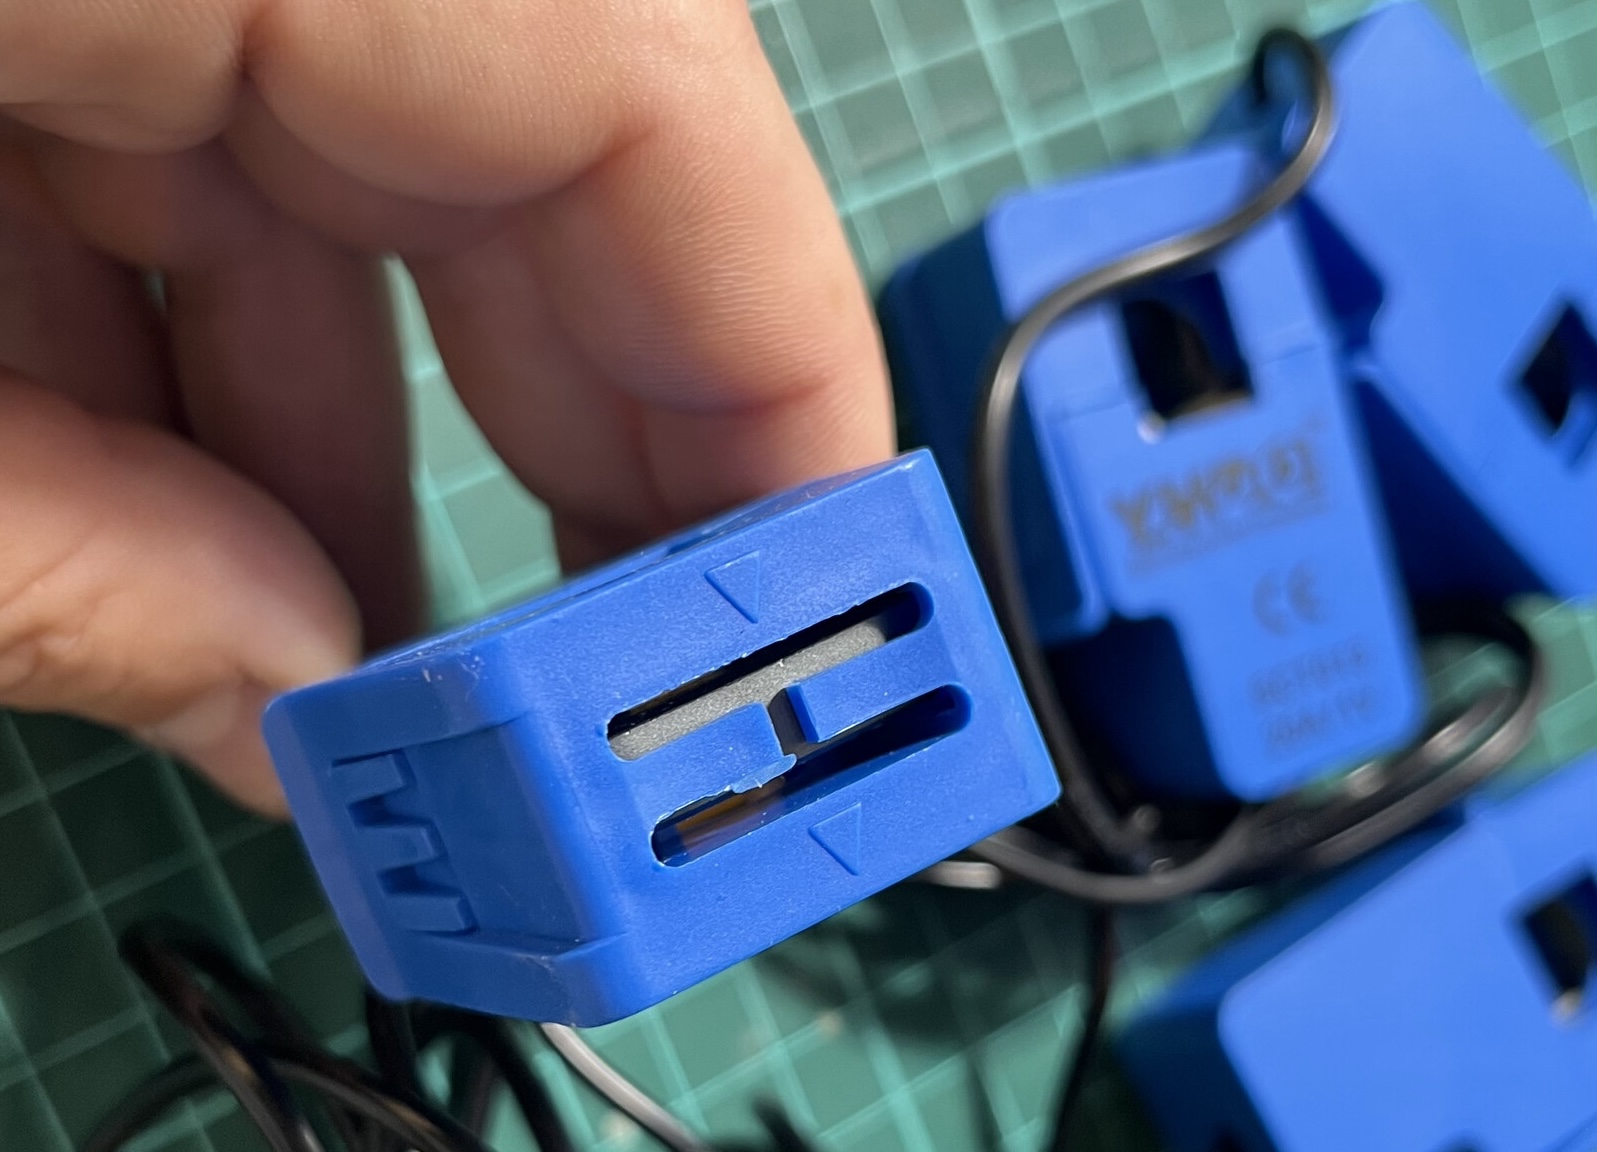
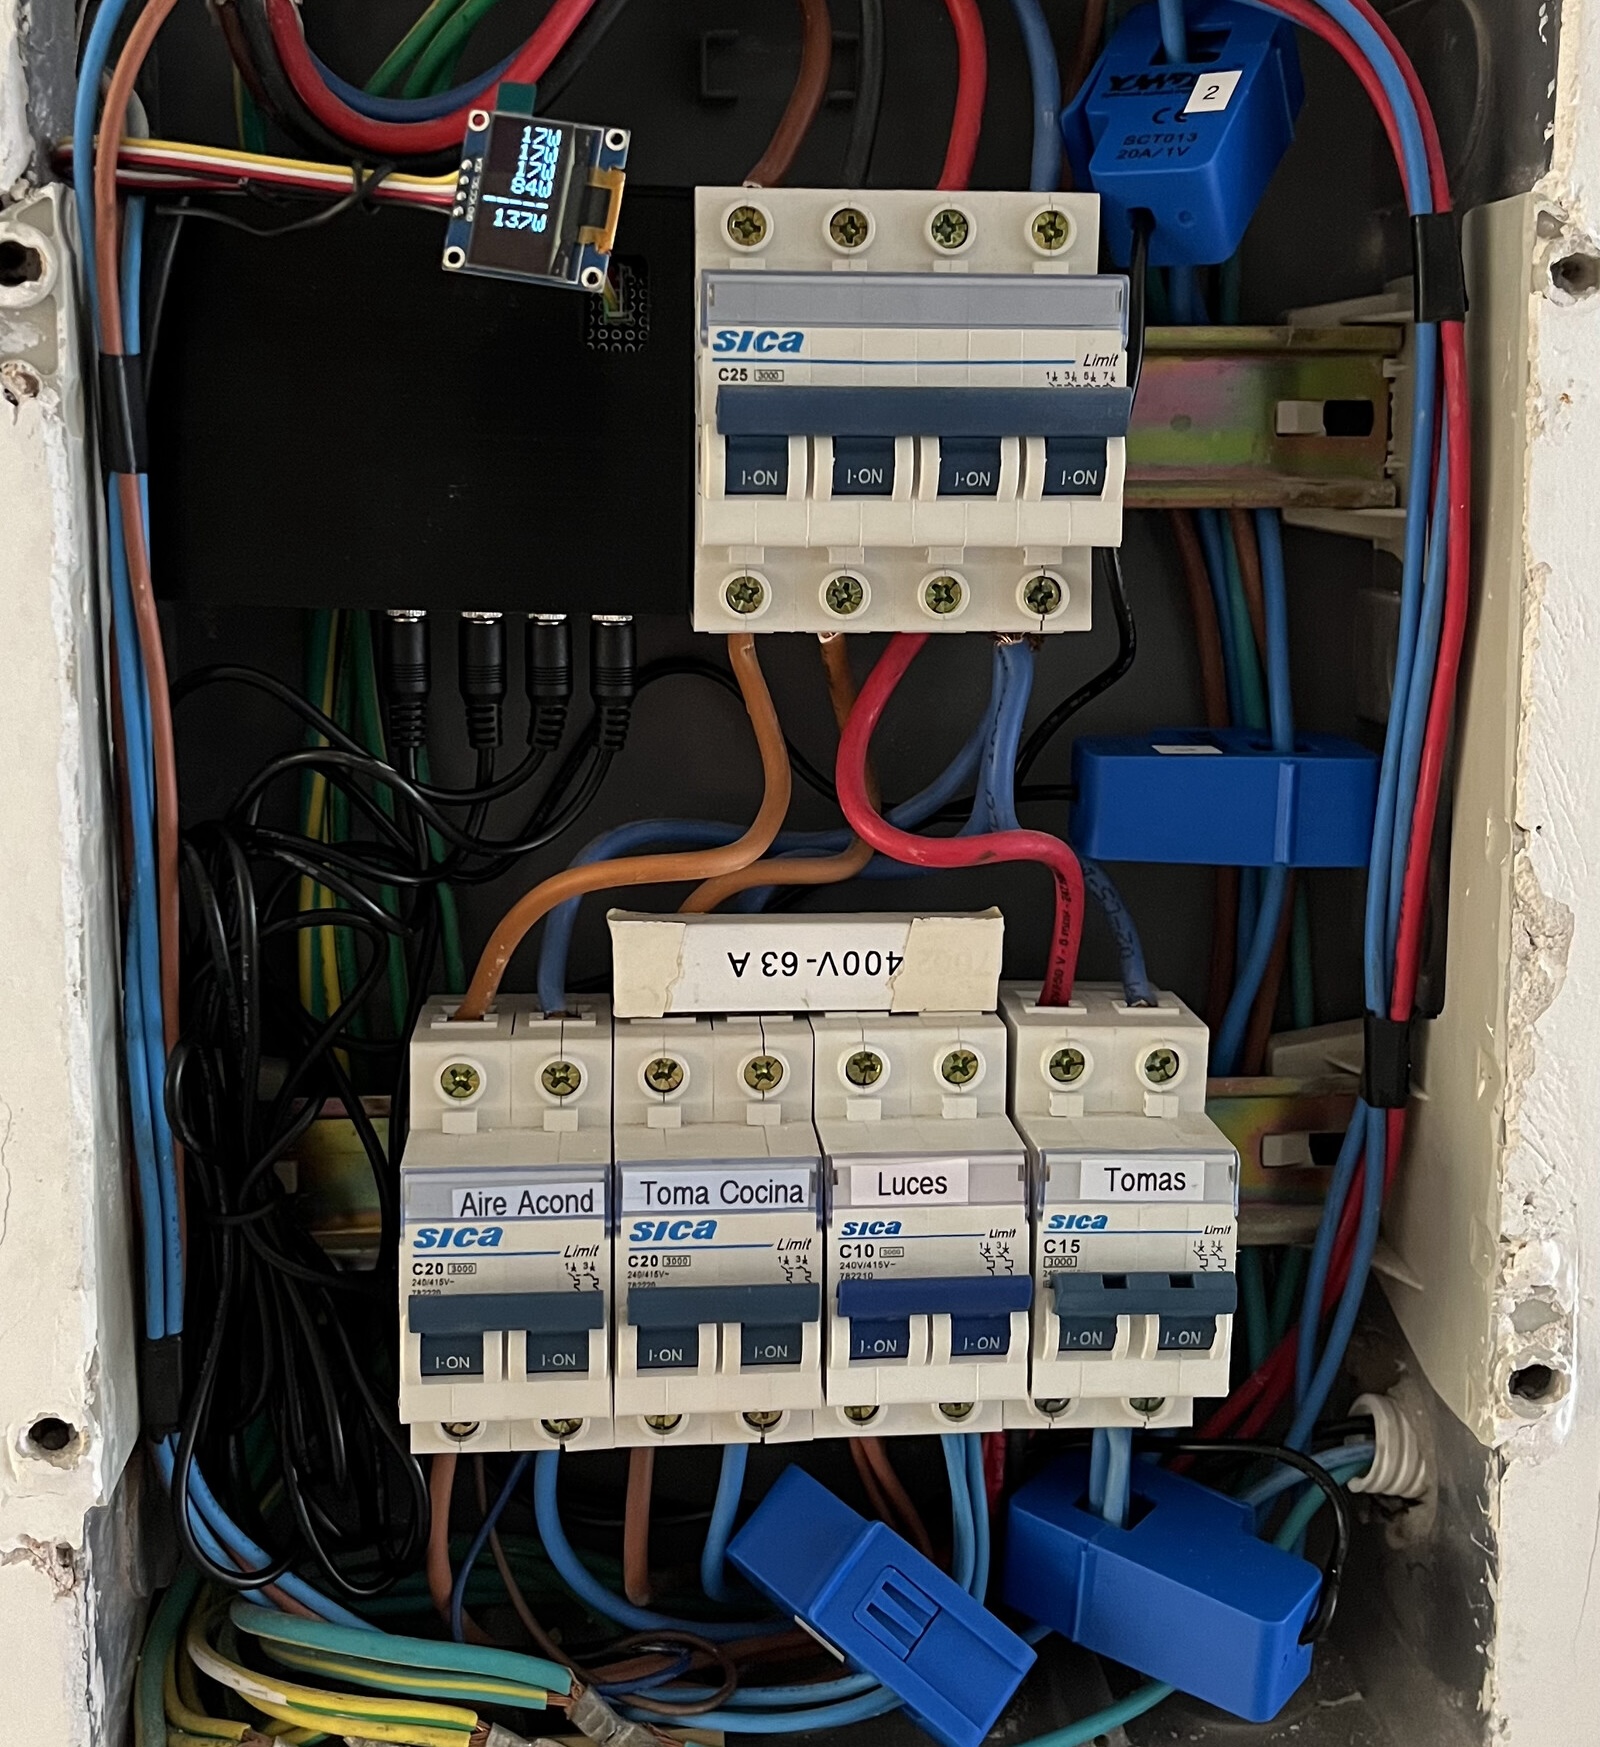
Digging around the Internet, I found the SCT-013 split-core current transformers. These are cheap, easy to install, and interestingly precise and reliable. More importantly, as they are split-core, I don’t need to modify the distribution panel wiring to install them. The SCT-013s come in different ratings. I chose the SCT-013-020, which has a 20A input and 1V output, built-in load resistance, and 1% accuracy and linearity. Beware that the sensors have a flow direction arrow printed over the clamp!
Reading and conditioning the signals
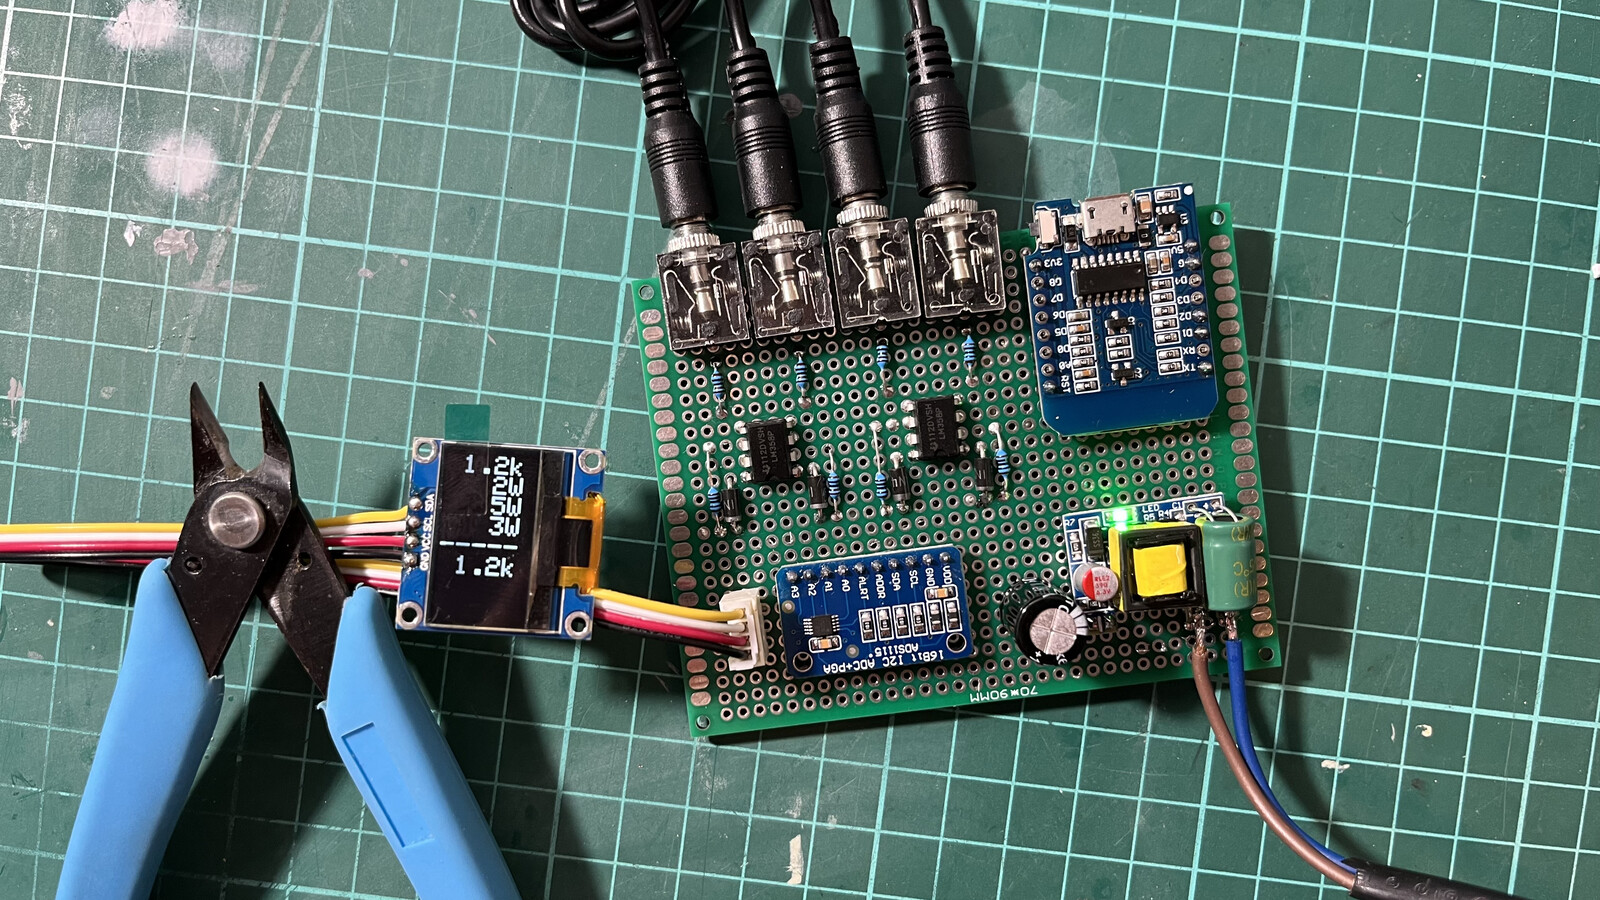
I want to export Prometheus metrics from these sensors, so I chose a Wemos D1 ESP8266 microcontroller. The ESP8266 has only one analog input, so analog-to-digital conversion is also required. The ADS1115 will be our ADC, and we will benefit from its excellent stability and precision when converting voltages.
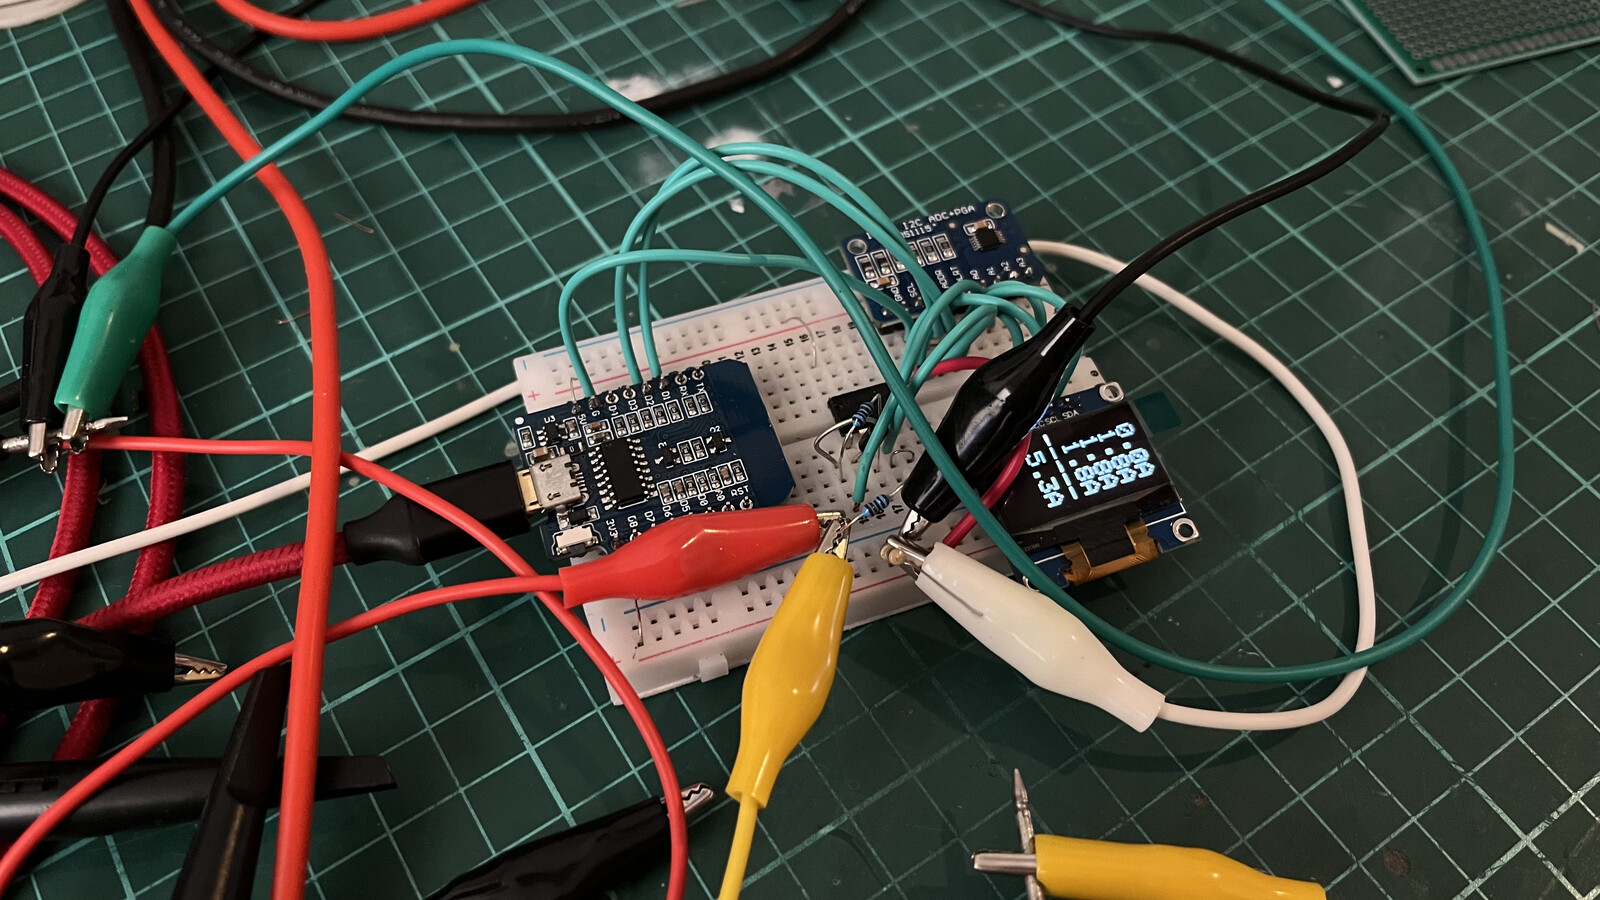
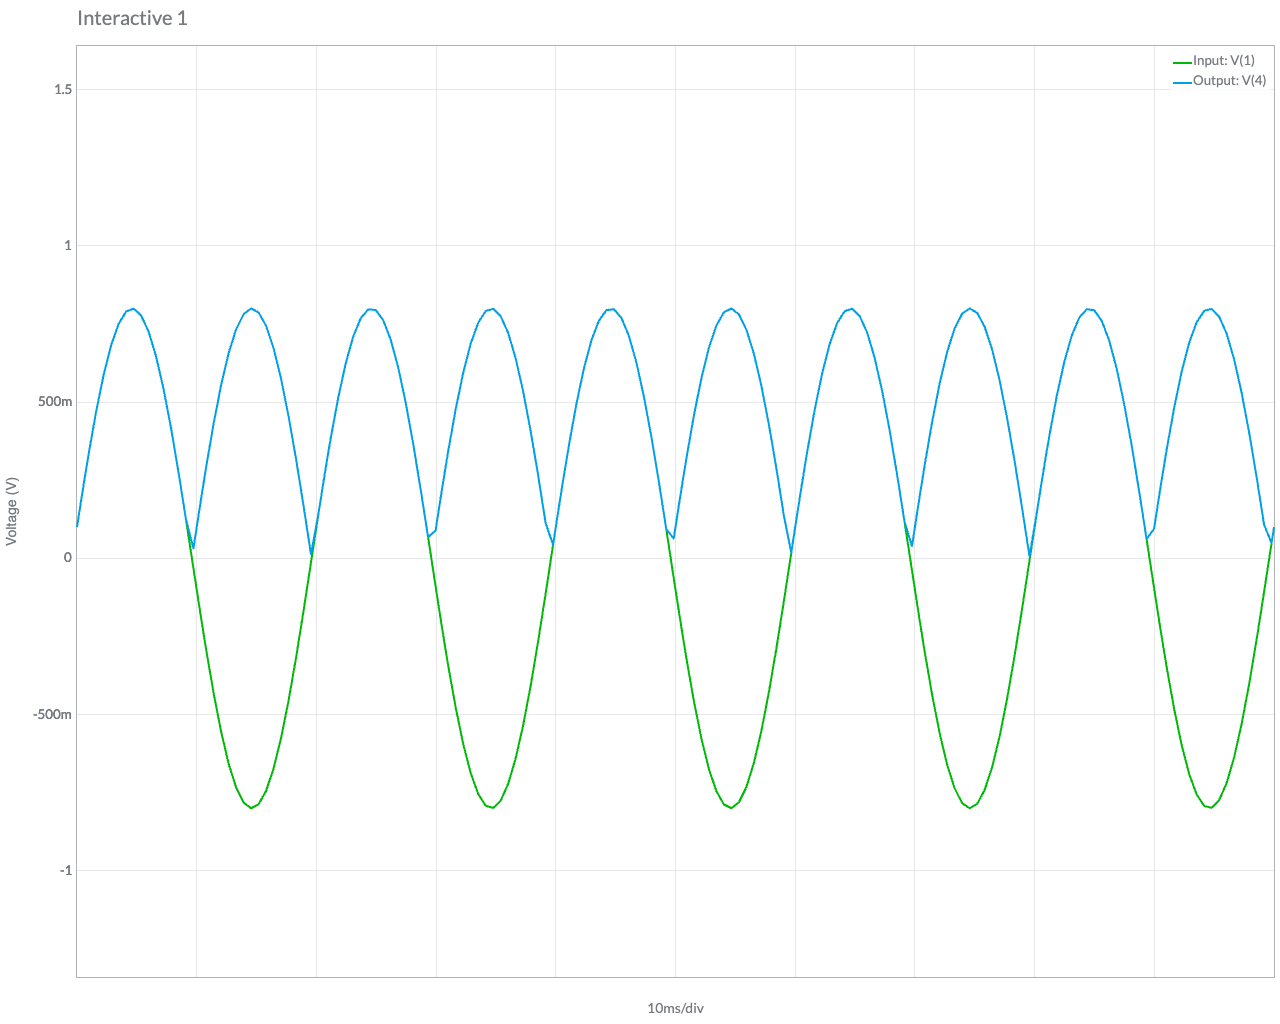
But there’s a problem! The SCT-013 clamps are just a transformer, so we get a 1V AC voltage at their outputs. AC voltages are not easily measurable with a microcontroller due to the nature of AC: the sine wave goes from -1V to +1V in a 50Hz period (for Argentina). While we could use two inputs of the ADS1115 for each SCT-013 and then measure the differential peak tension between the two inputs, I prefer an external signal conditioner using op-amps.
Digging into my drawers, I found a few LM358s, including a dual op-amp chip. Perfect. I will use the op-amp as an inverting operational amplifier; this way, we eliminate the negative part of the AC sine. If you have an LM324 lying around, you need one chip as a signal conditioner for four SCT-013 clamps, as the LM324 is a quad op-amp chip. Here’s the full schematic.
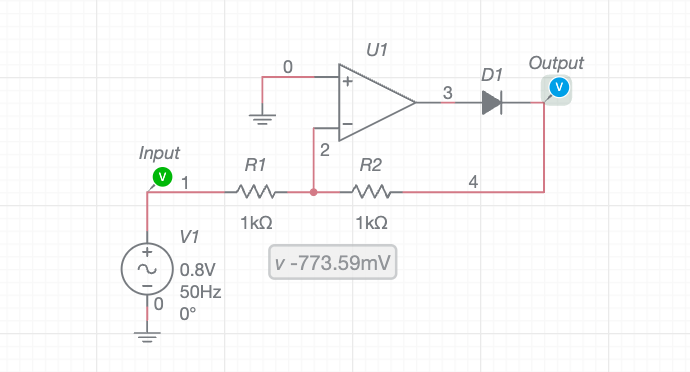
In this configuration, the op-amp will output only the positive part of the sine, so we will need to sample a couple of readings and then register the maximums of the sine.
The ADS1115 has two configurations: The I2C address, which, in my case, will be set to 0x48 by pulling down the ADDR pin to the ground. Then there is the gain configuration; as I don’t need mega precision, I set it to GAIN_TWO, which reads +/—2.048V with a precision of 0.0625mV per value in 16 bits.
To average the readings and get a more stable output, I am reading around 30 cycles at 50Hz; hence, SAMPLING_DURATION_MS is set to 600ms. We read the ADC value from the ADS1115 input on each loop pass and then convert it to the actual DC voltage computeVolts built-in function. The voltage is multiplied by the sensor current (20 for my 20A clamps), and then we keep the peak readings for both minimums and maximums. Then, we need to do the sum of the squares to represent the actual AC amplitude. The resultant value is then squared to compensate for the negative half cycles of the AC. The RMS voltage is calculated with the sqrt function using the averaged readings as the value. The same procedure is repeated for each clamp. Here’s a screenshot of the oscilloscope measuring ~2.1 Amps AC at the ADS1115 input.
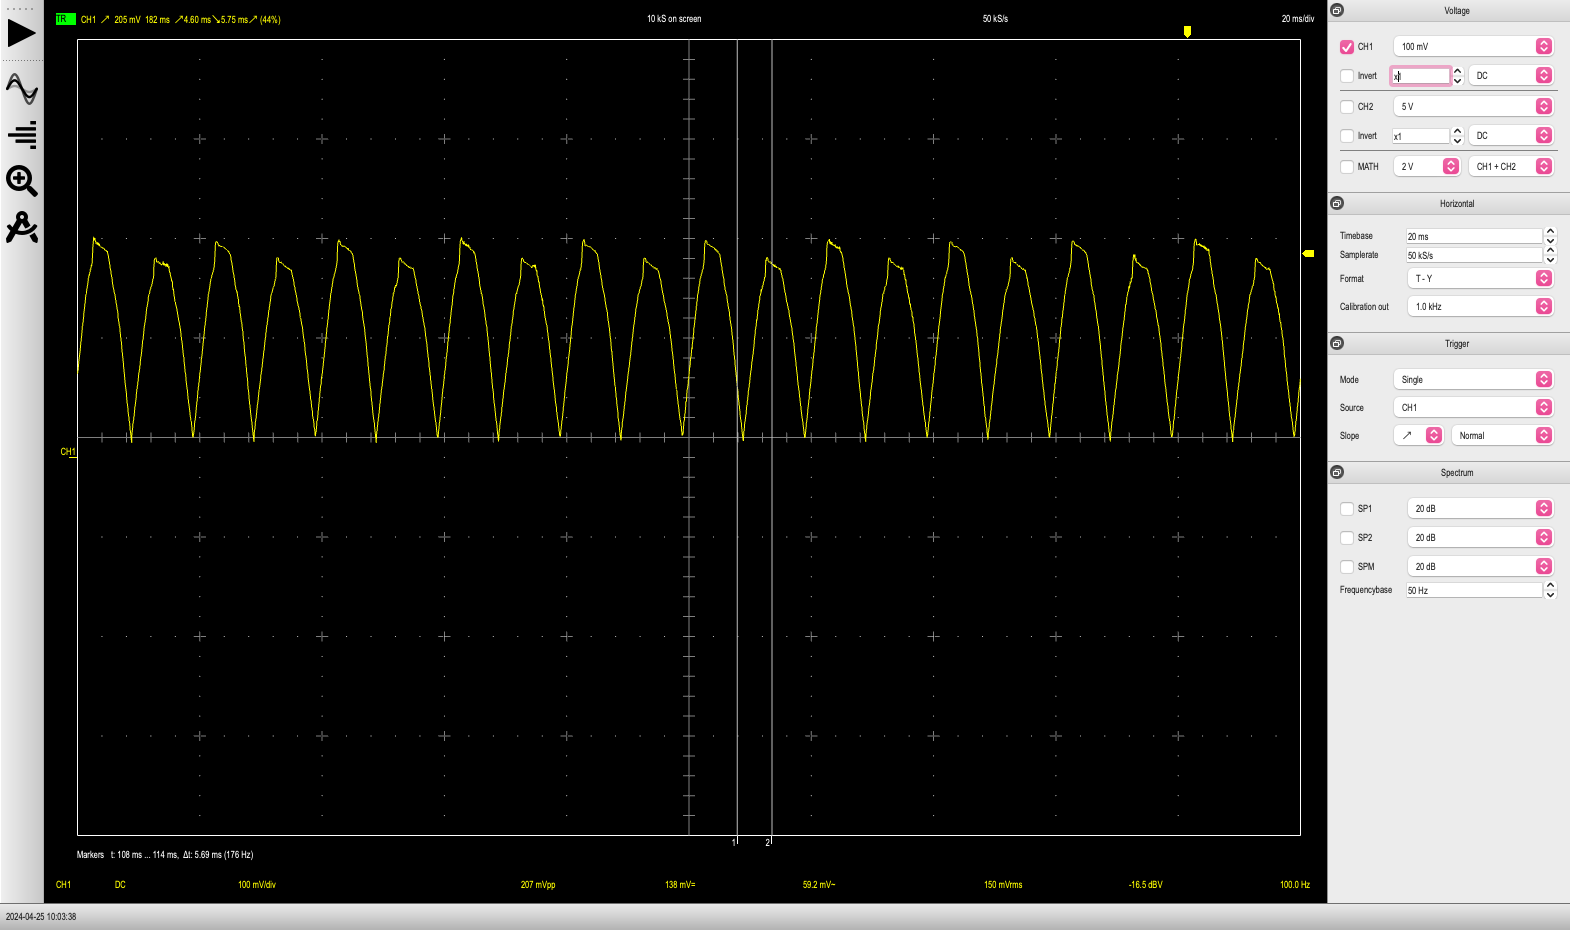
The oscilloscope measured ~207 mVpp of DC. Since our op-amp is configured as an inverting amplifier, the math is vOut = -(R2/R1) * vIn. My SCT-013s are 20A/1V so we can easily calculate the current of 207 mVpp as sqrt(0.207 * 20) = 2.034 Amps.
Displaying values
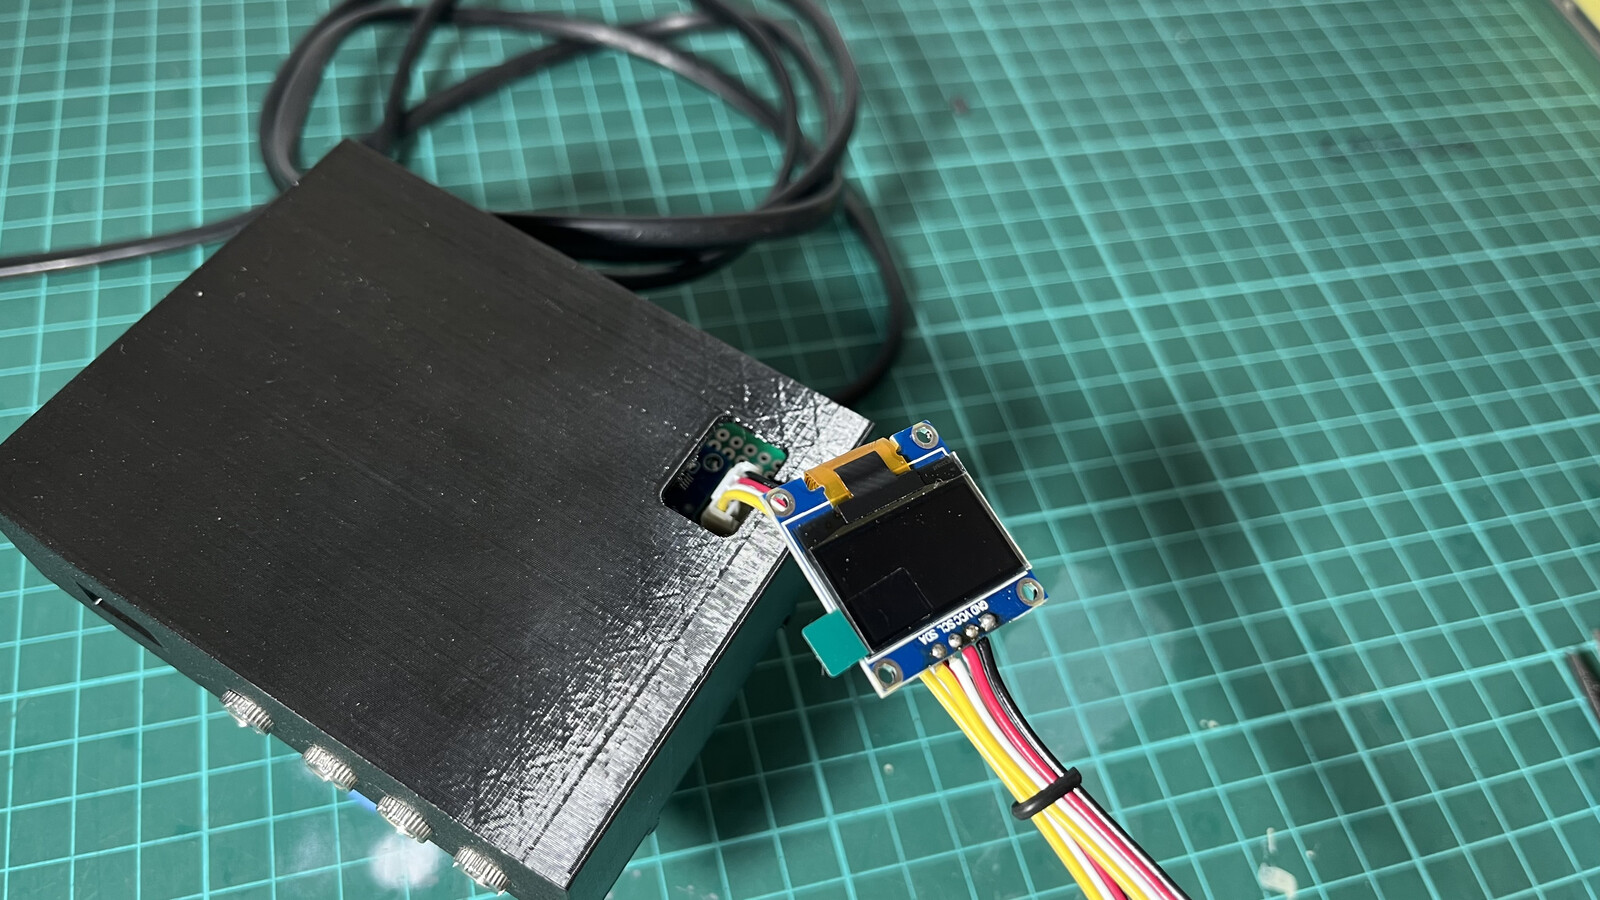
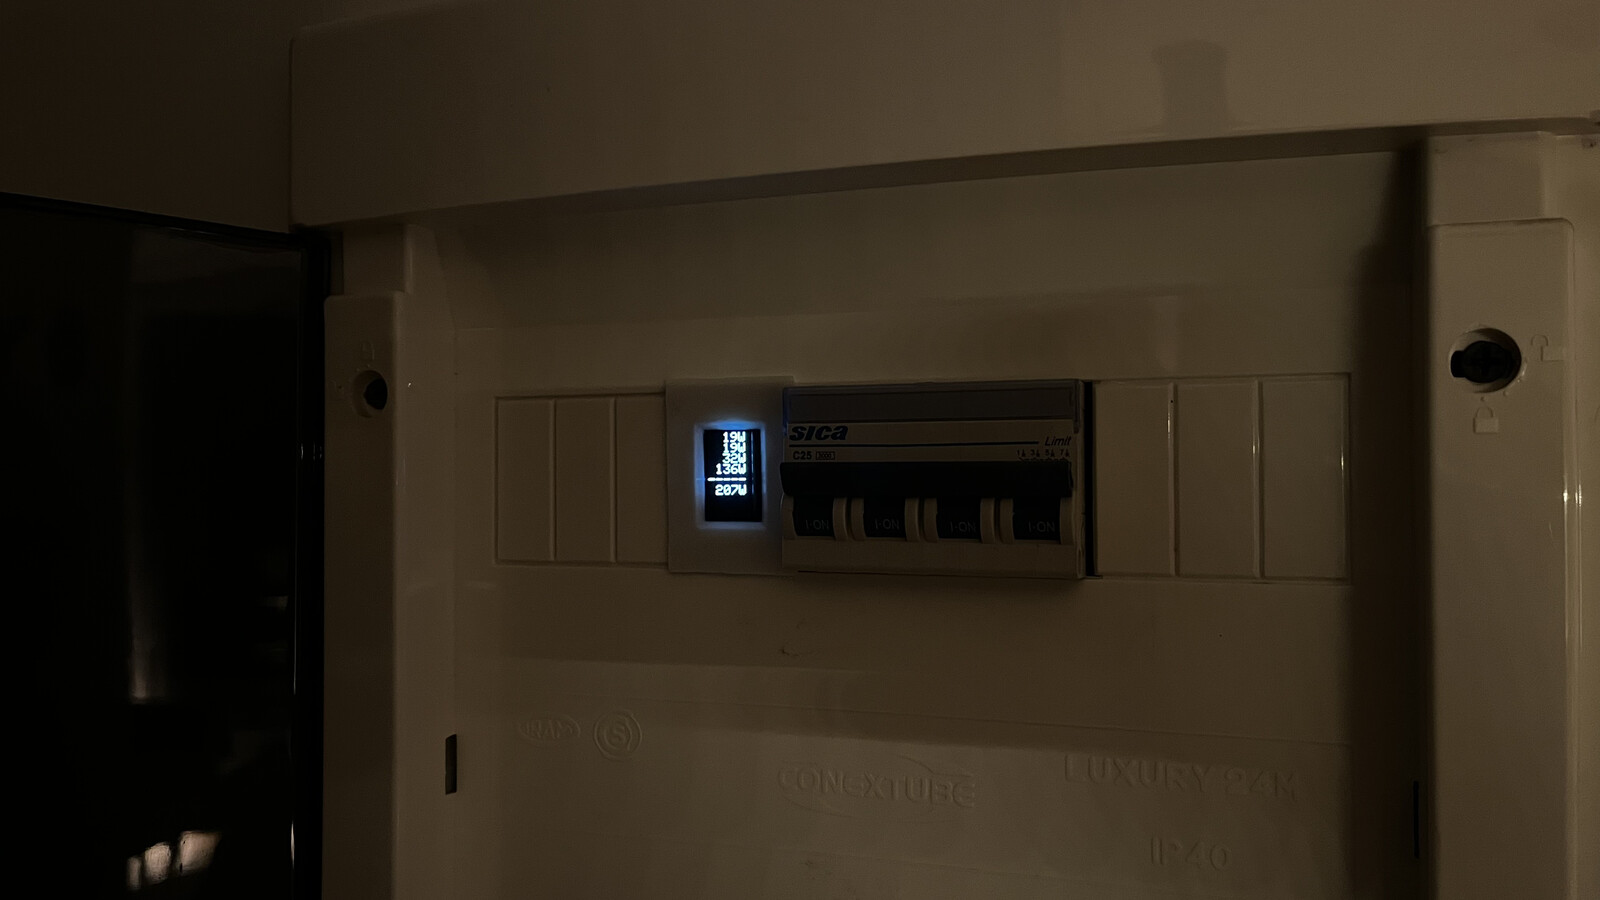
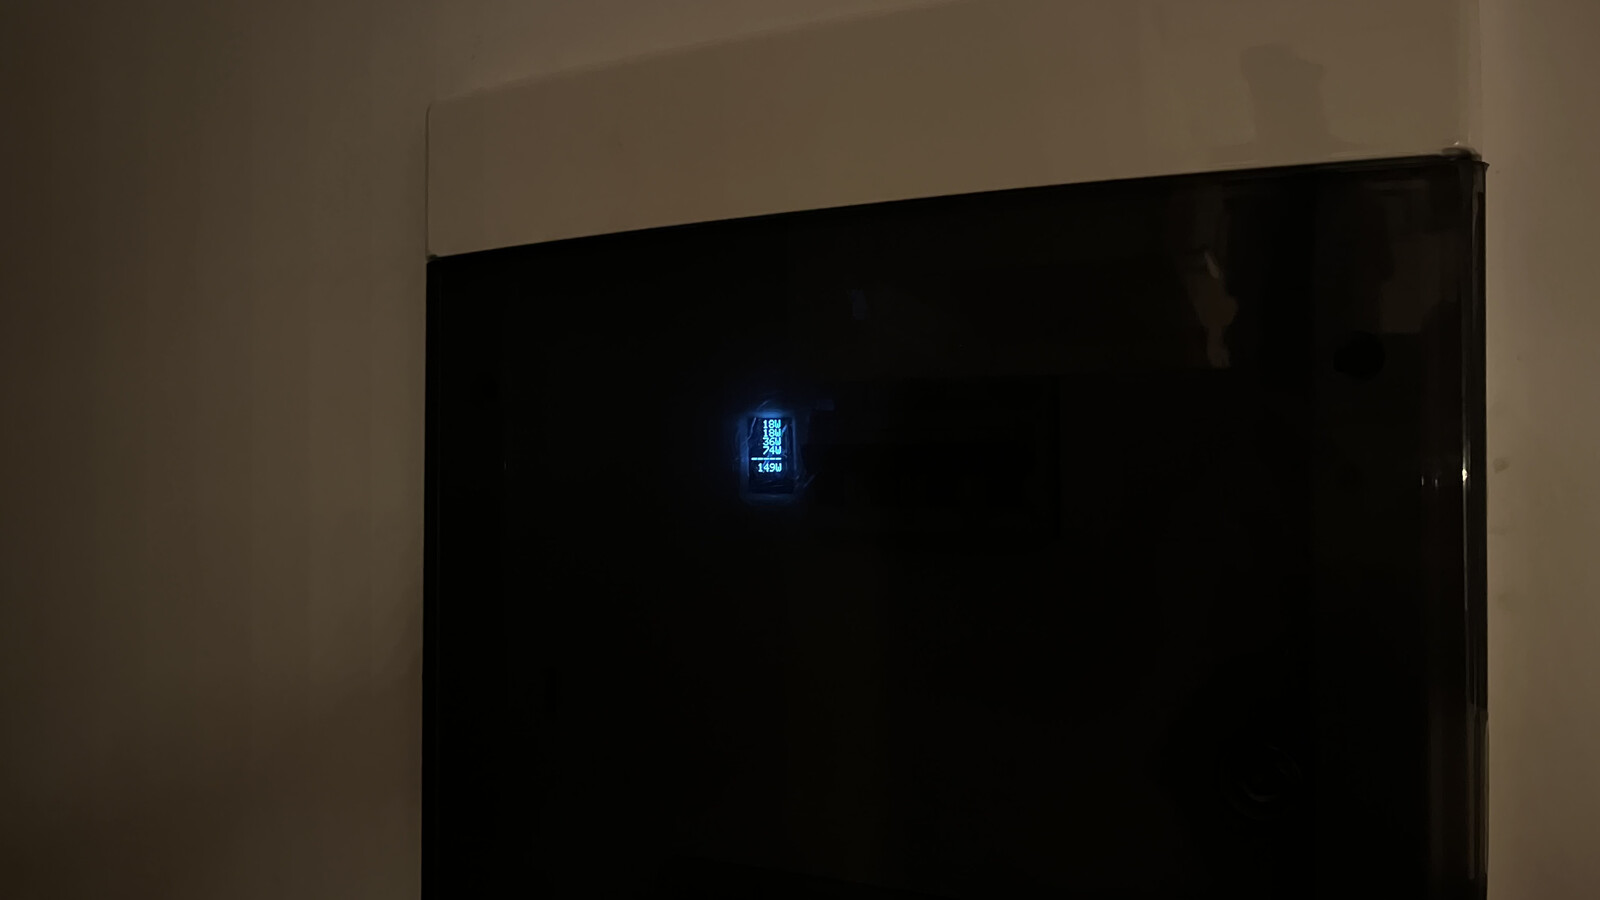
It would be helpful to have a display that informs the current values of each clamp and the sum of all readings in watts and ampere inside the distribution box. As I already used the I2C protocol for the ADS1115, I added a 0.96” OLED screen. The values change from ampere to watts on each loop iteration and vice-versa.
The display is configured to show the IP address when connected to the WiFi (during startup) and then to cycle between ampere and watts measurements. The first four lines correspond to each SCT-013 input, and the final reading is the sum of each measurement.
Prometheus exporter
I also wanted to keep track of the power usage in my existing Prometheus + Grafana stack. As I already deployed a Prometheus Pushgateway endpoint, this is as easy as pushing the metrics. Then, in Grafana, I can do the needed calculations, such as calculating the monthly energy spend.
# HELP line_current_amps Current (amps) flowing through a voltage line
# TYPE line_current_amps gauge
line_current_amps{line="line_0"} 4.32
line_current_amps{line="line_1"} 1.23
line_current_amps{line="line_2"} 0.01
line_current_amps{line="line_3"} 0.03
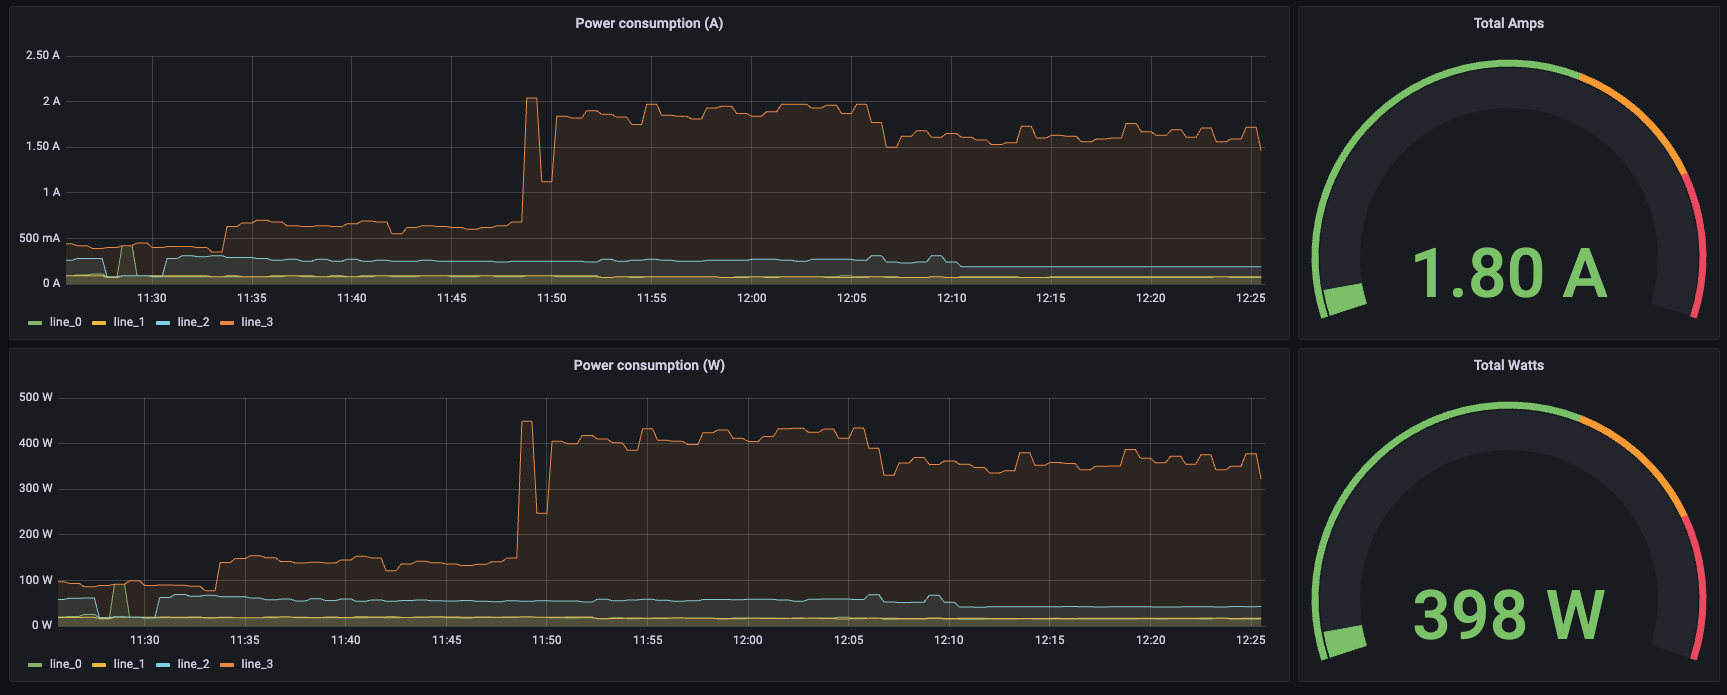
I turned on the 3D Printer at 11:48 (-:
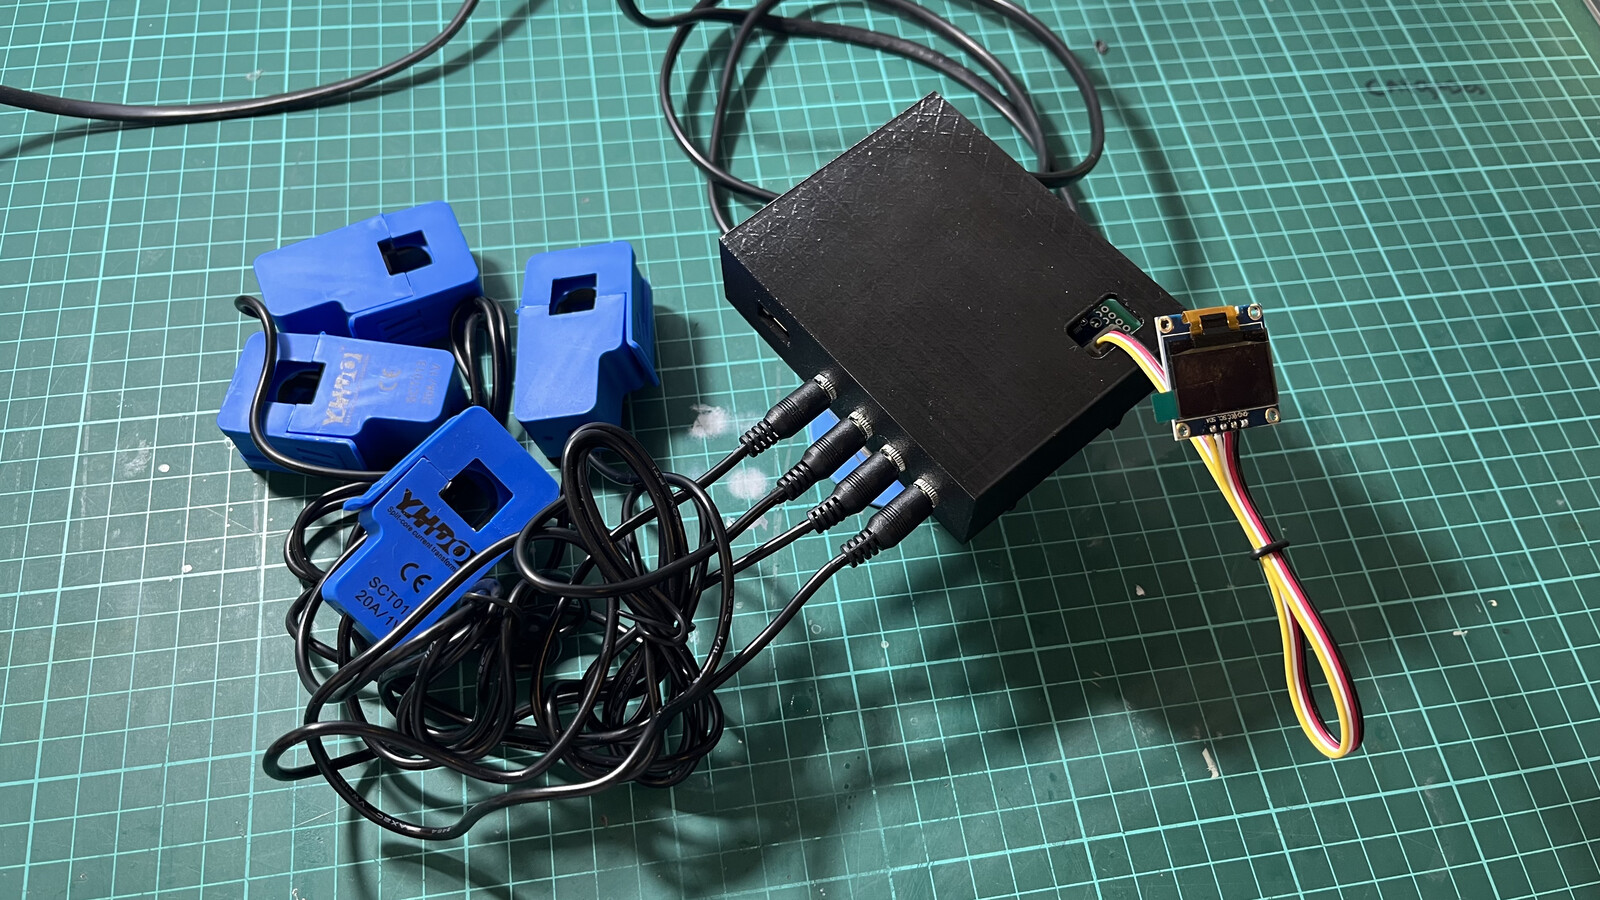
3D printed case
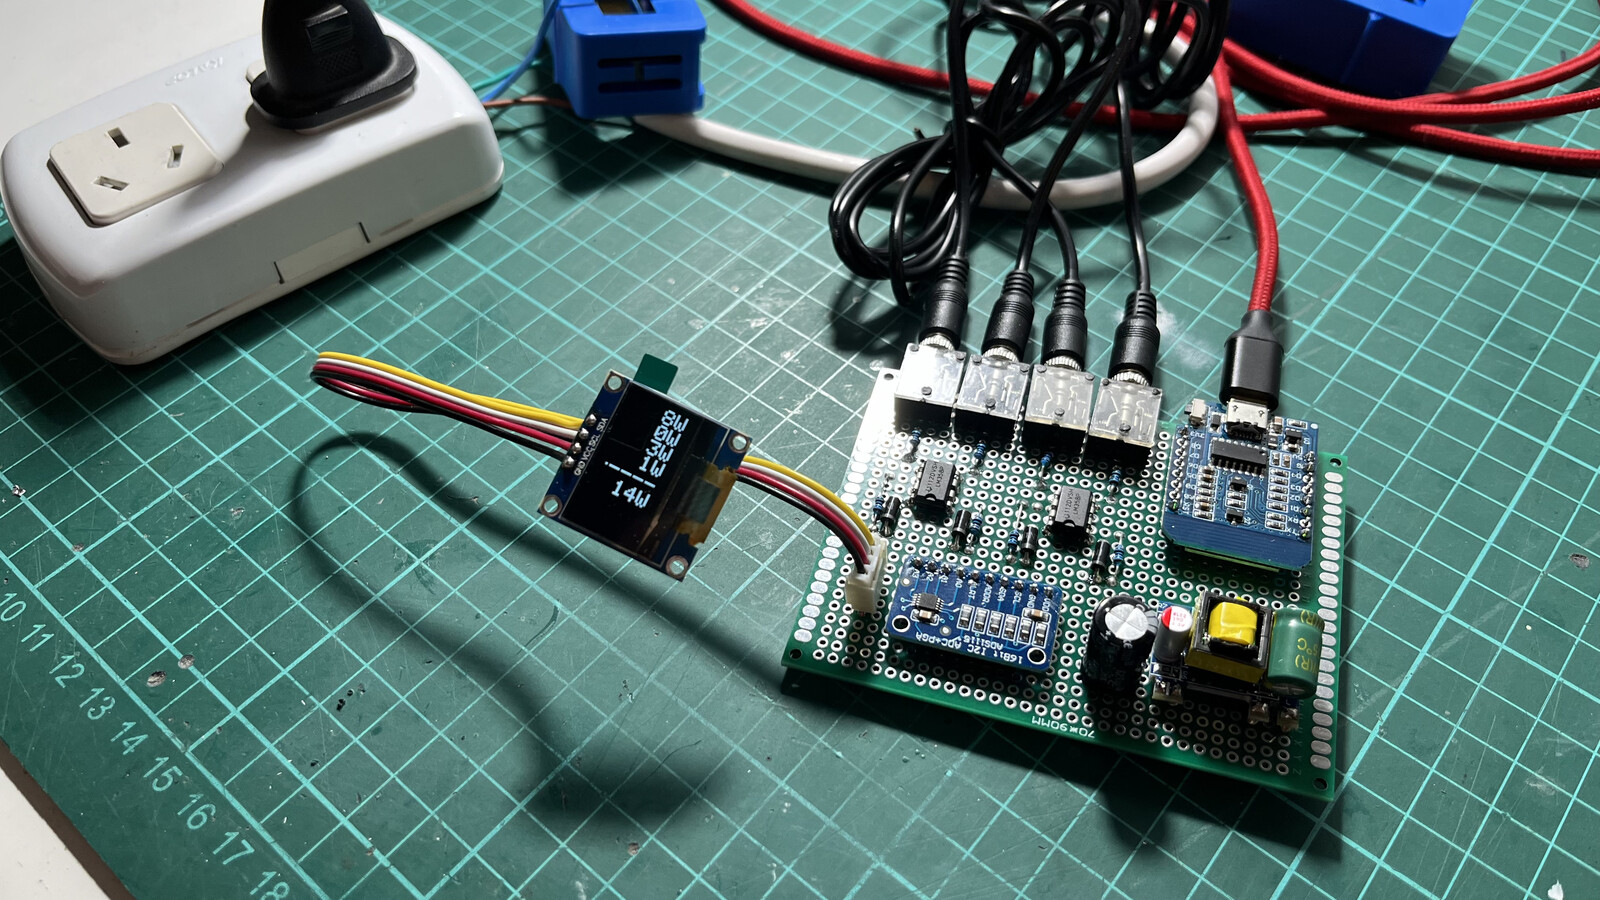
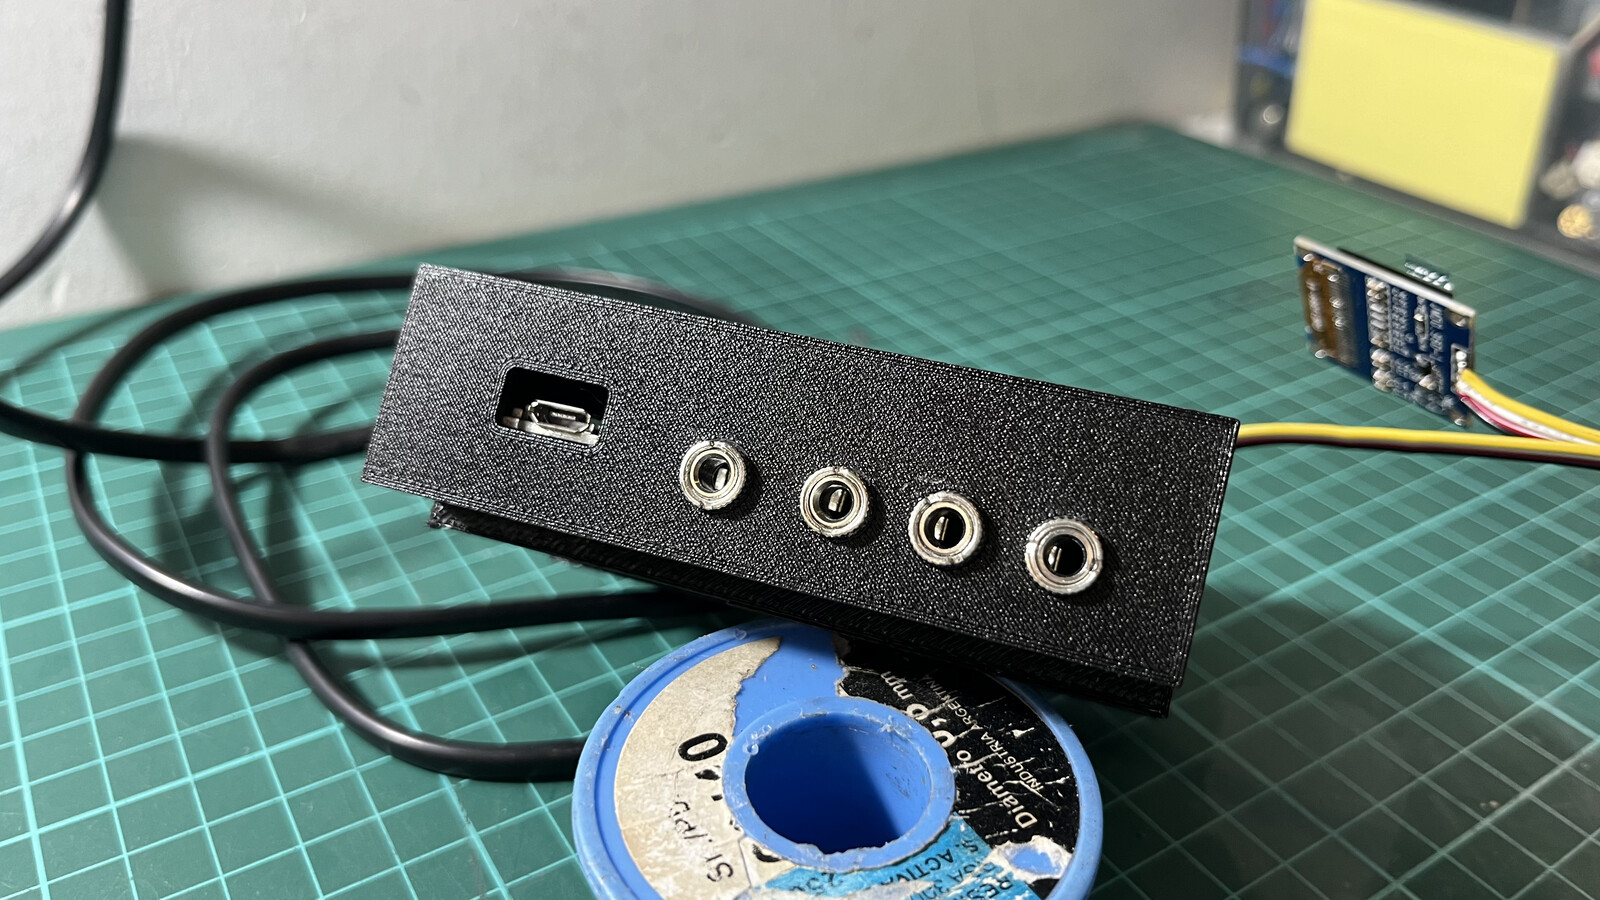
I built a case that fits the whole 90 x 70 mm PCB. You slide in the PCB and use the stereo jack nuts to fasten the prototype. There’s also an aperture for the Wemos D1 USB port, just for debugging purposes. The case also has an open rectangle where you can connect the OLED display. In the back, there’s a DIN rail-sized support to hang the case inside the distribution box.
Bill of Materials
Here’s the complete BOM and related files for building this project.
| QTY | Description | Usage |
|---|---|---|
| 1 | Wemos D1 | Microcontroller |
| 1 | ADS1115 | Analog to Digital converter |
| 1 | SSD1306 0.96” | Display |
| 4 | 3.5mm stereo jack | Clamp connectors |
| 1 | 70 x 90 mm pcb board | General purpose PCB |
| 1 | 5v power supply | Power the board from AC |
| 4 | SCT-013 | Clamps to measure AC power |
| 8 | 10k 1/8w resistor | Divider for the op-amps |
| 4 | 1N4007 diodes | Half wave rectifier |
| 2 | LM358 | Convert AC sine wave signal |
Pictures
Internals showing how I mounted the clamps
The AC power meter hooked to the power distribution
And with the lid closed
Video showoff
A quick video on how values are displayed